Participants
Participants aged 18 years and older were recruited from an existing database of volunteers at Hörzentrum Oldenburg gGmbH (abbreviated as HZO in the following). This non-profit organization is affiliated with the Carl von Ossietzky Universität Oldenburg and partners with the “Hearing4all” Cluster of Excellence funded by the German Research Foundation ( It works with a global network of scientific and industrial collaborators to develop innovative audiological methods and relies on the support of about 2,000 local volunteers. After screening for completeness, the final dataset prepared for public release via Zenodo (https://zenodo.org/records/14177902)41 includes 581 individuals, aged 18 to 86 years (n = 255 female; median age = 70.0 years; mean age = 67.31 years; standard deviation (SD) = 11.93 years). The data was anonymized in accordance with the General Data Protection Regulation (GDPR; Regulation (EU) 2016/679). Each participant was assigned a unique identifier to maintain anonymity while enabling multivariate analyses. Data protection approval for the preparation and open release of the dataset was granted by the Data protection and Information Security Management Office at the Carl von Ossietzky University of Oldenburg, Germany.
While the OHHR cohort includes a higher proportion of individuals with hearing loss than would be expected in the general population, its purpose was not to reflect population-level prevalence of hearing loss. Rather, the aim was to establish a large cohort oversampling a wide range of hearing impairments, offering a robust foundation for research focused on the deaf and hard-of-hearing individuals. This contrasts with many population-based datasets, which often include a majority of normal-hearing individuals. Additional information on the hearing loss prevalence and how the sample compares to population-level estimates is provided in the Technical validation section.
Procedure
The data collection process began with an 11-page questionnaire, referred to as the “home questionnaire”, which volunteers completed at home. It was sent via postal mail to potential participants along with study information and consent forms, with instructions to complete everything using pencil and paper and return it via prepaid mail. Participants who returned the completed home questionnaire were then invited to a one-hour lab-based test session. This initial process ensured that participants understood the nature of the data they would be sharing prior to any in-person testing. The test session included a face-to-face interview to discuss the individual’s medical history, as well as several assessments. Besides a clinically standard pure tone audiogram, supra-threshold loudness perception was determined with the Adaptive Categorical Loudness Scaling42. In addition, two speech-recognition-in-noise tests (the Göttingen Sentence Test – GÖSA26 and the German Digit Triple Test – DTT28), and two cognitive tests (Vocabulary size test or Wortschatztest – WST43 and the Dementia Detection test – DemTect25) were performed. All measures were undertaken by trained professional staff members. Hearing assessments, including Pure Tone Audiometry, Adaptive Categorical Loudness Scaling, the GÖSA, and the German DTT, were performed without hearing aids, even for regular users. However, cognitive assessments and the questionnaires, where optimal hearing was required were conducted with hearing aids for those who typically used them33.
Ethics and data anonymization
The local ethics committee at the Carl von Ossietzky Universität Oldenburg reviewed and authorized the original data collection between 2013 and 2015, ensuring compliance with the ethical standards described in the Declaration of Helsinki44, except for the requirement for preregistration of the study. Participants were compensated with 12€ per hour for their involvement.
To prepare the current publicly available dataset, additional ethical approvals and data protection measures were implemented. All records were anonymized to protect participant privacy. To minimize the risk of re-identification, k-anonymity (k = 4) was applied, ensuring that each participant’s quasi-identifiers were indistinguishable from at least three others. Further safeguards were introduced, including grouping categories with fewer than four cases into broader classifications. The full anonymization process was reviewed and approved by the university’s data protection officer, and documentation outlining the procedures and risk assessments are available upon request. At the time of the original data collection, approximately 40% of participants had consented to the storage of their contact information. These individuals were re-contacted and provided explicit consent for the publication of their anonymized data. For the remaining 60%, whose data had already been pseudonymized and who could not be re-contacted, a waiver of consent for data sharing was granted by the data protection officer following the completion of the anonymization process.
Data protection approval for the preparation and public release of the dataset was subsequently granted by the Data Protection and Information Security Management Office at Carl von Ossietzky Universität Oldenburg (Application Number: DSM-H4A Open Dataset/20241113-0009).
Self-reports included in the home questionnaire (HQ)
Subjective experience of hearing loss related consequences reflects the functional impact of hearing loss on an individual’s life, an aspect that cannot be captured by audiometric measures alone. There has been much discussion in the literature about the low association between examiner-driven (“objective”) and self-reported (“subjective”) measures of hearing loss. However, it is crucial to also characterize individuals with hearing loss in terms of their subjective hearing-related experience, along with their subjective health status (chronic diseases), self-reported demographics (age, gender), personality traits (self-efficacy, self-esteem), mood (depressive symptoms) and social context (social network size)45. Research by Wang and colleagues46 show that underreporting of hearing problems is associated with age, ear problems, lifestyle, and subjective beliefs about hearing health. Notably, older adults tend to underreport their hearing difficulties47. A combined approach of self-reports and audiometric measures is also effective in detecting high-frequency hearing loss. Furthermore, self-reports are particularly sensitive in contributing to the identification of mid-frequency hearing loss48. Understanding the factors that influence self-reported hearing problems, including cognitive abilities, education, and lifestyle, enables researchers and practitioners to interpret these reports more precisely and use them as complementary measures to audiometry for prediction and for deriving individualized treatment recommendations49. The HQ covered several key assessments, which are described in detail below.
Hearing anamnesis
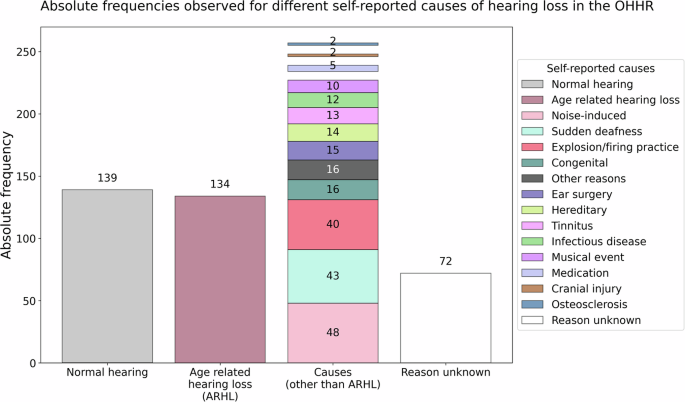
The HQ collected detailed information on the individual’s hearing history, including diagnosis and duration of hearing impairment, subjective ratings of hearing problems in both quiet and noisy environments, and noise exposure. Individuals were asked about the causes of their hearing difficulties (see Fig. 1), hearing aid use (past and present), duration of use, and any history of sudden sensorineural hearing loss, for example due to middle ear infections. Age-related hearing loss (ARHL) was among the most frequently reported causes. In the context of this dataset, ARHL also known as presbycusis is a bilateral, symmetrical, and progressive sensorineural hearing loss that occurs with advancing age. It is characterized by reduced hearing sensitivity, especially for high-frequency sounds, and may be accompanied by reduced speech understanding, particularly in noisy environments. Ear noise/tinnitus was also addressed. This included its occurrence, duration and the physical or mental discomfort it causes. Furthermore, to evaluate the comfort and experience of hearing aid use, the questionnaire included three items from the seven-item International Outcome Inventory for Hearing Aids50.

Self-reported causes of hearing difficulties. Note. Absolute frequencies of self-reported causes of hearing difficulties in the OHHR dataset (N = 581). A total of 370 individuals reported a perceived cause of hearing loss, while 72 reported not knowing the reason and 139 reported normal hearing. Age-related hearing loss (ARHL) or presbycusis showed the highest prevalence among the reported causes (n = 134). Other reported causes included noise induced (n = 48), sudden deafness (n = 43), explosion or firing practice (n = 40), congenital causes (n = 16), and various other factors (e.g., ear surgery, hereditary factors, tinnitus, infections, concerts, medication, injury, otosclerosis; n = 2–15).
General health and lifestyle
Individuals provided information about their overall health, including any limitations in daily activities due to health problems, how their physical and mental health had affected task performance in the four weeks prior to data collection, pain impacting daily activities, emotional well-being, and perceived memory issues. They also reported any chronic conditions diagnosed in their lifetime and in the past 12 months, such as respiratory disorders, cardiovascular diseases, diabetes, musculoskeletal, or psychiatric conditions (see Table 1). Some related conditions were grouped together for brevity in Table 1 (e.g., heart attack, angina pectoris, and cardiac insufficiency as cardiovascular conditions), although they were asked separately to reflect how patients typically recognize these conditions and to enable more detailed information beyond a single general measure. These data are valuable, for example, for assessing the burden of comorbid conditions and for calculating a comorbidity index according to the German National Health Examination Survey51. This index quantifies the impact of chronic conditions on the use of health care services, on quality of life, and on other health-related outcomes.
Short form 12 health survey (SF-12)
The health status section of the HQ also included the SF-1252 health survey, which is a concise version of the 36-item health survey, but comprehensive enough to provide an overview of an individual’s physical and mental health. The SF-12 contains 12 questions, yielding two summary scores. The physical component score (PCS) quantifies limitations in physical functioning, role limitations due to physical health problems, bodily pain, general health perceptions, and social functioning limitations due to physical problems. The mental component score (MCS) indicates vitality, emotional well-being, and social functioning limitations due to emotional problems, as well as interference with daily activities caused by mental health problems. The PCS and MCS raw scores are separately transformed into standardized scores and included in the OHHR as separate scores (T-values, with M = 50, SD = 10).
Media consumption and device usage
A specific section of the HQ aimed to assess the participant’s media consumption habits and preferences. It included questions about headphone use for TV and radio, detailing the types of hardware and software used (e.g., radio, Bluetooth, infrared) at the time of data collection and how often they were used. Individuals also reported their use of technology for work and personal activities, both with and without hearing aids. In addition, they were asked about their experiences with sound levels, including situations where sounds were perceived as too loud with or without hearing aids. The survey also addressed the demand and perceived sound quality of hearing aids, the frequency of increasing TV volume without them, and individual musical preferences and expectations for sound quality.
Technology readiness
The HQ also included a 12-item questionnaire to measure the use of adaptive technology, particularly among older adults53. The measurement instrument is based on the theoretical concepts outlined in the technology acceptance model54, which postulates how perceived usefulness and ease of use influence technology adoption. Furthermore, it also incorporates concepts from Ajzen’s55 work on personal beliefs about competence and control. Neyer and colleagues53 extended these concepts by developing a comprehensive model of technology readiness that integrates both attitude-oriented and personality-theoretical perspectives. The main construct measured by the 12 items is technology readiness, or the willingness to invest time and effort in learning and using modern technology. Additionally, there are three subscales that can be measured with this questionnaire. Technology competence reflects the perceived ability and confidence in using technology effectively56. Technology acceptance quantifies an individual’s relationship with modern technologies, primarily in terms of interest in technical innovations54. Technology control reflects the degree to which individuals feel that they have control over their technology use and can overcome challenges56.
Demographic and socio-economic status
The demographic information was collected in both the clinical interview (age, gender, language status, etc.) and the HQ (household composition and living situation). Participants also reported socio-economic details about themselves, such as their educational degree, profession, occupation, and household income. The Scheuch-Winkler Index (SWI) was used to quantify socio-economic status (SES) by summing up education, occupation, and net income, resulting in a score ranging from 3 to 2157. This index is crucial for describing health disparities by investigating how socio-economic factors influence health outcomes. These scores were categorized into three SES groups—low, medium, and high—to represent different socio-economic strata within the German population.
Overall, the HQ collected extensive data that allows for a comprehensive characterization of the impact of hearing loss on an individual’s quality of life and their biopsychosocial characteristics, making this dataset highly valuable for informing precision audiology. By including validated instruments along with newly designed questions, the HQ provided a thorough dataset for analyzing the complex, multivariate interactions between hearing health, general health, technology use, and socio-economic factors. All of this is complemented by further objective measures of hearing and cognition, which are described in the following.
Clinical interview for anamnesis
To gain a detailed overview about the participants’ hearing health, beyond the survey data recorded with the HQ, an expert interviewer conducted a structured face-to-face interview with the participants. The interview was designed to record further demographic information and questions pertaining to the onset, progression, and specific characteristics of the individual’s hearing loss, along with details on cochlear implants or any other implant, hearing aid use (access and frequency), family history of hearing loss, and history of ear infections.
Audiological tests
Pure tone audiometry
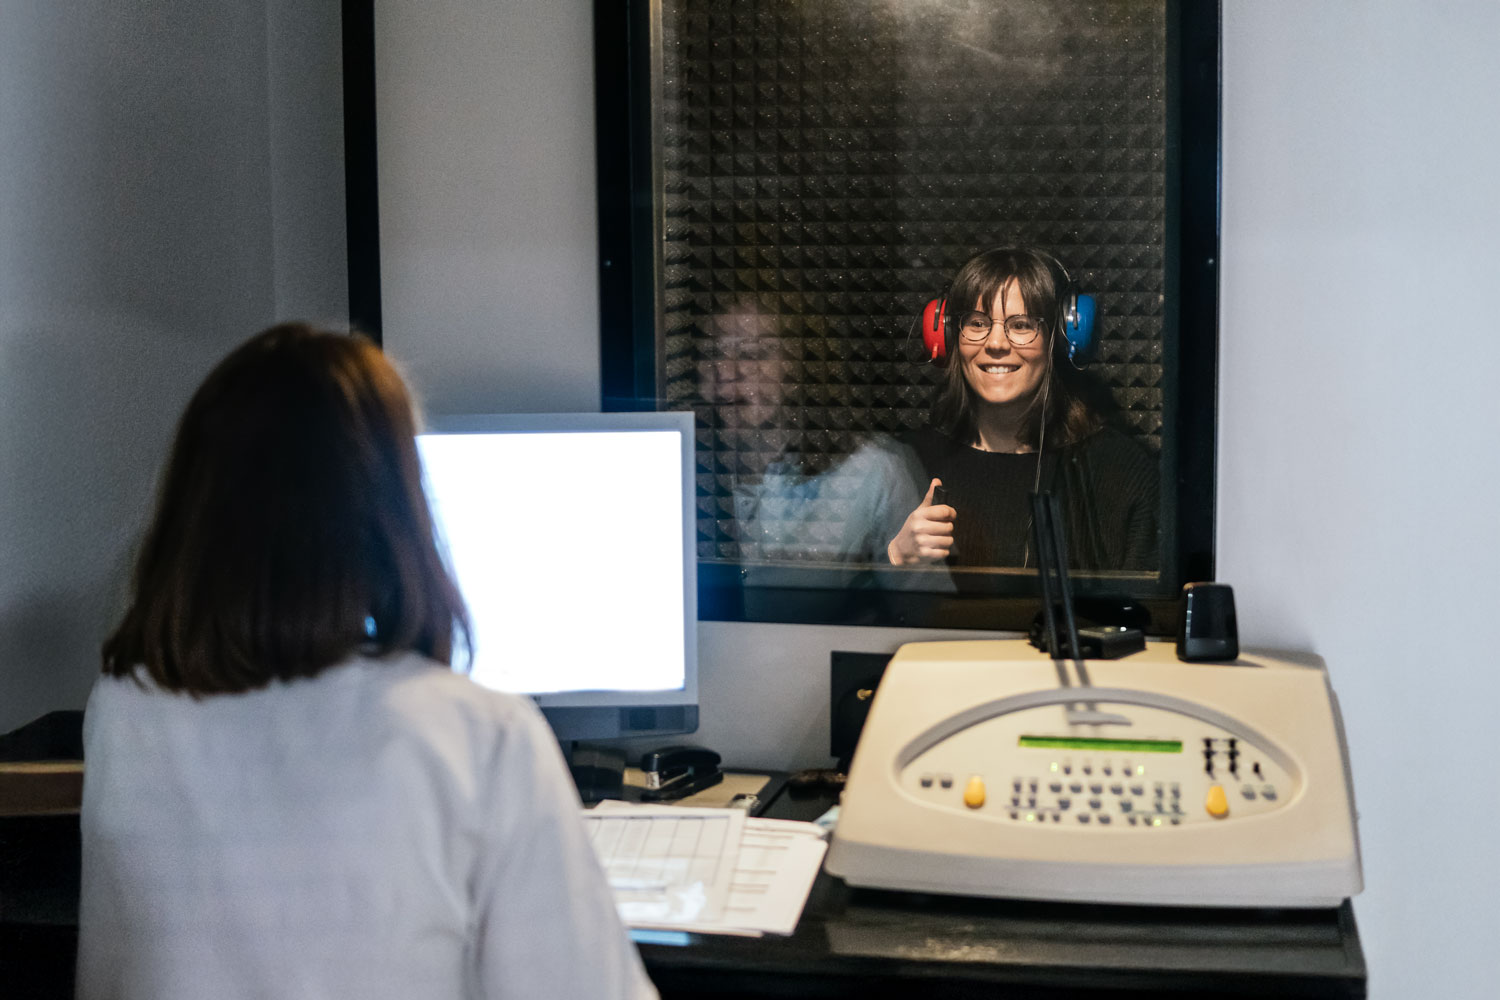
Pure tone audiometry is a standard tool used in clinical settings to identify hearing impairments. The resulting audiogram provides a comprehensive assessment of hearing sensitivity, conductive hearing loss, cochlear function, and discomfort levels. The audiometry procedure for OHHR was performed in the laboratory, with each ear assessed independently. Air conduction hearing thresholds were measured using a Siemens Unity II audiometer with Sennheiser HDA200 headphones, while bone conduction thresholds were evaluated with a RadioEar B71 bone conduction transducer. This was done with sinusoids for frequencies ranging from 125 Hz to 8000 Hz in an acoustically shielded audiometry booth. Bone conduction measurements were limited to 500 to 4000 Hz, following standard clinical practice. Below 500 Hz, the vibration threshold is too close to the hearing threshold, making measurements unreliable. Frequencies above 4000 Hz are excluded due to excessive distortion produced by the transducer. A standard clinical threshold method was used with a step size of 5 dB, where a threshold was accepted if the probe tone was not heard twice at lower levels and detected twice at higher levels. To summarize overall hearing sensitivity, the Pure Tone Average (PTA) was calculated as the mean hearing threshold across 500, 1000, 2000, and 4000 Hz. Additionally, measurements of uncomfortable loudness levels (UCL) were performed at 500, 1000, 2000, and 4000 Hz. Tone levels were increased in 5 dB increments and participants were asked to indicate when the sound became uncomfortably loud by pressing a button. The respective presentation level was recorded, and the presentation sequence was continued for the next test frequency at a presumably comfortable level. The complete assessment took approximately 13 minutes.
Adaptive categorical loudness scaling
Adaptive Categorical Loudness Scaling (ACALOS) is a method used in clinical audiology to measure an individual’s subjective perception of loudness according to Brand and Hohmann42. It is particularly adept at diagnosing loudness recruitment, which is commonly encountered among individuals with sensorineural hearing loss. This phenomenon is characterized by an excessive increase in perceived loudness as the sound level increases.
The stimulus signals used were one-third-octave bands of noise (duration 2 seconds) presented through Sennheiser HDA 200 headphones for 20 trials in a pseudo-random order.
Participants were asked to rate their perceived loudness of each stimulus level using an 11-category response scale, ranging from “not heard” to “too loud”. The categories corresponded to 0, 5, 15, 25, 35, 45 and 50 categorical units, with four unnamed categories situated between them (10, 20, 30, 40 cu). The presentation levels were adaptively adjusted based on the participants’ previous responses, thereby ensuring that the test assessed the whole individual range of loudness perception42. Measurements were recorded successively for 1500 and 4000 Hz narrow-band noise stimuli for the left and right ear separately. A loudness function can be fitted to the responses of each of the ACALOS measurements using either the Brand and Kollmeier58 staircase method or the BTUX fitting method59, depending on the researcher’s preference33.
The ACALOS procedure was designed to provide a reliable and efficient estimation of loudness functions with a small number of trials. It has good test-retest reliability, with intraindividual standard deviations for loudness levels ranging from 4-5 dB, comparable to or slightly better than other procedures that require more trials. The adaptive approach allows for efficient use of trials and better coverage of the auditory dynamic range, particularly benefiting people who are hard of hearing. Additionally, ACALOS eliminates the need for prior measurements of hearing thresholds, simplifying the testing procedure42.
While Pure tone audiometry and ACALOS are effective in assessing hearing sensitivity, everyday communication depends on the ability to recognize and understand speech, particularly in noisy environments. Individuals with similar ages and audiogram thresholds can still exhibit substantial differences in speech comprehension in noisy settings. This underscores the importance of including speech-in-noise measures as part of a comprehensive audiological assessment such as the OHHR intends to provide. These additional measures are described below.
Digit triplet test
The Digit Triplet Test (DTT) employs a closed-set response format that facilitates convenient self-testing via telephone or the internet, primarily for hearing screening purposes. It consists of lists of twenty-seven-digit triplets spoken in background noise used to adaptively determine the speech recognition threshold (SRT). In the adaptive procedure, the signal-to-noise ratio (SNR) for each trial is influenced by the participant’s previous performance. The initial SNR was set at 0 dB, with the noise level remaining constant. The speech presentation level, however, varied: it was decreased following correct identifications and increased if the listener had difficulty understanding any digit28. For the current database, the test was administered in the presence of an expert in a controlled laboratory environment. The DTT takes approximately three minutes to complete. The background noise was presented at 65 dB sound pressure level (SPL) for most participants. For those with severe hearing loss, where 65 dB SPL was not sufficiently audible, the presentation level was increased to 80 dB SPL to ensure the test stimuli could be perceived60. The purpose of this test is to estimate the SRT, which is defined as the speech level at which a person can hear 50% of the numbers correctly. The DTT offers several advantages, including its brevity, familiarity with the stimuli employed, efficiency, online accessibility, and availability in multiple languages. It has also been shown to be an effective tool for both adults and children with cochlear implants, demonstrating reliability and robustness against learning effects, linguistic abilities, and personal factors such as educational background61.
Göttingen sentence test
The Göttingen Sentence Test (GÖSA) is an open-set speech intelligibility test in which listeners hear 20 meaningful sentences, each presented one at a time in background noise and consisting of three to seven words. The 20-sentence list is randomly selected from a pool of 10 predefined sets of everyday sentences. It provides a more realistic representation of communication situations than tests that have single words or sounds presented in noise. Each sentence is meticulously designed to maintain perceptual equivalence and consistent difficulty levels across different sets, ensuring reliable and comparable results26,62.
During the testing session, the sentences were presented with test-specific speech-shaped noise via a free-field loudspeaker in a sound-attenuated room. Participants were instructed to repeat as many parts of the sentence as they could after each sentence presentation. The GÖSA takes about 5 minutes to complete. The noise level during testing was set at 65 dB SPL and increased to 80 dB SPL for participants who were unable to perceive the stimuli adequately at the lower level due to severe hearing loss. The GÖSA also employs an adaptive procedure to determine the SRT with precision in the range of ± 1 dB. The noise level is kept constant, and speech levels are adjusted based on the listener’s responses, facilitating accurate assessment of speech perception abilities. In summary, the test offers a comprehensive assessment of speech intelligibility, using ecologically valid materials and carefully calibrated background noise to simulate real-world listening conditions58.
Cognitive measures
Screening tests for dementia and cognitive assessment in general require the participant to hear and comprehend the test items sufficiently well. Similarly, audiological tests, except visual inspection of the ears, demand cognitive abilities such as attention, working memory, and semantic knowledge. These abilities are essential for attending to, comprehending, remembering, executing instructions, and communicating with the examiner. Therefore, an accurate diagnosis of cognitive and audiological conditions is contingent upon a thorough examination of both63.
Dementia detection test
The Dementia Detection test (DemTect) is a neuropsychological screening tool employed to assess cognitive impairment. It is recognized for its high sensitivity and time efficiency, given that it can be administered in 8 to 10 minutes. DemTect comprises five subtests that cover a wide range of cognitive abilities, including immediate and delayed recall of verbal information, working memory, language and number processing, and executive functioning. In the Word List subtest, participants are presented with a 10-item word list over two trials to assess both immediate and delayed recall, thus targeting memory function, which is an essential domain for detecting mild cognitive impairment (MCI) and dementia64,65,66. The Number Conversion task assesses executive function and language processing by requiring participants to switch between different representations of numbers, such as words and numerals. It captures a range of errors, including those related to language impairment, lexical and syntactic processing, and literacy difficulties. Such impairments have been frequently observed in individuals with dementia67,68. In the Semantic Fluency Task (‘Supermarket’), participants are asked to generate and name items belonging to a specific category, such as supermarket items, within a limited time. It assesses a range of cognitive abilities including attention, working memory, cognitive flexibility, problem solving, semantic memory, language production and processing speed. Studies show that verbal fluency is often impaired in the early stages of dementia69,70,71,72. The Digit Span task requires participants to repeat sequences of numbers in reverse order and is a measure of working memory. Deficits in this area are considered one of the earliest signs of dementia25,73,74. Finally, in the Delayed Recall task, participants are asked to recall the 10-item word list presented at the beginning. This task assesses long-term memory.
The overall score is calculated by summing the scores of each subtest, with each subtest incorporating age-based scoring adjustments for participants under and over 60 years of age to account for age-related differences in cognitive abilities. DemTect has demonstrated robust construct validity and high reliability in both test-retest and inter-rater assessments. Notably, it excels in detecting mild Alzheimer’s disease (AD) with a sensitivity of 100% and mild cognitive impairment with a sensitivity of 80%. In contrast, the widely used Mini-Mental State Examination shows limited efficacy in identifying MCI, with a sensitivity of only 69%23,25. This tool enables the identification of potential cognitive decline or impairment among participants in OHHR.
Vocabulary size test
The vocabulary size test (in German, Wortschatztest-WST43) was used to assess the verbal intelligence and language comprehension of the participants included in the OHHR. Factor analytic validation studies have revealed that indicators derived from the vocabulary tests load highly on a general cognition factor (commonly called the g-factor), meaning that the scores from WST can be interpreted as effective indicators of g33,43. Therefore, this assessment has the additional purpose of estimating premorbid intelligence levels in individuals with mild to moderate cognitive impairment and tracking the progression of dementia.
The WST is a 10-minute test consisting of 40-word recognition tasks. In each task, participants must identify the real word presented alongside five similar non-words. The tasks are arranged in a line-by-line format, with increasing difficulty. The raw score is determined by the number of correctly identified words. This test demonstrates high reliability, as evidenced by a split-half reliability coefficient (r = 0.95) and Cronbach’s Alpha (α = 0.94). The score is largely independent of age, exhibiting a very low correlation with age (r = 0.08), but it is positively correlated with educational and vocational qualifications (r = 0.60). It has been normed for a wide age range (20-90 years) and has been standardized using a representative sample (N = 572) and Rasch scaling to ensure equivalent measurement of abilities across items.
link


